

With passage of their respective farm bills, the House and Senate are taking the formal steps to form the conference committee and begin negotiations to complete the legislative process. Among the many differences that the conference committee will need to resolve are those involving the conservation programs in Title II of each bill. The conservation title has historically been the least controversial of the mandatory funding titles, but the different directions taken by the House and Senate could indicate greater difficulty in negotiating it this year. This article looks at the challenges ahead for the conferees and the potential implications for farmers.
Background
Title II of the farm bill contains the suite of programs that provide conservation assistance to farmers and landowners. In summary, the Conservation Reserve Program (CRP) uses long-term (10 to 15 year) contracts to retire land from production, paying a yearly rental rate to the landowner in return for agreement to put the entire field under conservation cover and to refrain from producing any crop on it. It is an acreage-based program and the 2014 Farm Bill lowered the acreage cap to 24 million acres. The Agricultural Conservation Easement Program (ACEP) provides for the purchase of an easement on property for restoring and maintaining grasslands or wetlands, or for protecting farmland from development pressure. ACEP is a dollar-based program with the 2014 Farm Bill providing $250 million for fiscal year (FY) 2018. Together, these programs represent conservation policy designed to remove land (whole fields or acres) from agricultural production.
By comparison, the Environmental Quality Incentives Program (EQIP) and the Conservation Stewardship Program (CSP) represent working lands conservation policy; assistance for conservation practices and planning within continued agricultural production. EQIP provides for direct cost-share payments to producers for installation and maintenance of conservation practices. It is a dollar-based program in that Congress authorizes a top-line amount of funding ($1.75 billion for FY2018), and it has a heavy emphasis on livestock operations with 60 percent of the authorized funds reserved for livestock practices. CSP is an acreage-based program that uses five-year contracts for improving conservation practices across the entire farm for those who meet a threshold of existing conservation activities. The 2014 Farm Bill instructed USDA to increase enrollment by 10 million acres per year through 2022, but operate the program so that the national average payment rate equals $18 per acre. In addition, the 2014 Farm Bill created the Regional Conservation Partnership Program (RCPP) that uses the authorities and some portion of funding from the other programs to coordinate conservation efforts on a regional basis.
These program features—reserve or working lands policy and acreage-based or dollar-based authorization—are important in terms of the assistance available to farmers, how funds are distributed among the states, as well as for the Congressional Budget Office (CBO) baseline projections that are used to reauthorize the farm bill (farmdoc daily, April 12, 2018). Additionally, when Congress revises programs and funding in a farm bill, CBO analyzes the revisions to produce cost estimates which are CBO’s best projection for how changes to the programs will either increase or decrease direct spending. CBO’s cost estimates represent the official score of legislation as compared to the baseline projection of spending (CBO June 21, 2018; CBO May 2, 2018). Table 1 summarizes the CBO scores for the programmatic changes to the major programs in the conservation title of the House and Senate farm bills for the ten-year (2019-2028) budget windows. 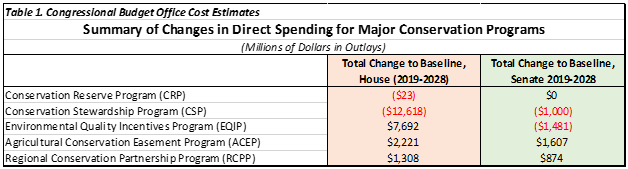
Briefly summarizing the changes represented by the scores in Table 1, the House farm bill eliminates CSP and increases funding to EQIP, ACEP and RCPP with an overall decrease in spending over the 10 years of $795 million. It increases the CRP acreage cap but reduces rental rates, including decreasing rental rates for fields that are re-enrolled in the program multiple times. Finally, it adds stewardship contract authority to EQIP presumably as a substitute for CSP (farmdoc daily, June 7, 2018). Among the various changes to conservation programs in the Senate farm bill are reductions in funding for EQIP and the acreage enrollment instruction for CSP (from 10 million acres per FY to 8.8 million). The savings from these changes are used to increase funding for ACEP and RCPP so that the conservation title in the Senate farm bill does not increase or decrease spending.
Discussion
Investments in natural resources conservation made by these programs may be increasing in importance due to pressure on farmers to reduce nutrient losses from farming and improve the sustainability of production practices (for more information see, Coppess, 2018; Coppess 2017; Coppess 2016). Moreover, sustainable farming and nutrient loss reduction goals are likely arguments for Congress to prioritize working lands conservation policies and, in particular, acreage-based programs such as CSP. Doing so would focus conservation policy on investments that align closely with farming and in those states with the most land in crop production.
To begin the evaluation of the potential impacts of the House and Senate farm bills,  Figure 1 illustrates the total obligations from the major conservation programs as reported by the Natural Resource Conservation Service (NRCS) and by the Farm Service Agency (FSA) for the Conservation Reserve Program (CRP). The discussion presumes that those states receiving the most funds from the conservation programs have the most to lose if those programs are changed or if funding for the program is reduced.
Figure 2 adds partial perspective for the spending illustrated in Figure 1 using the total  acres planted to all field crops as reported by the National Agriculture Statistics Service (NASS), averaged for the 2008 to 2017 years. Conservation dollars are generally invested in farming, which includes cropland, thus acreage in crop production is one indicator of the demand for conservation funding. This would particularly be the case for acreage-based programs such as CSP and CRP. Acres in production, however, provide an imperfect or incomplete comparison because EQIP is a cost-share program with authorized funding levels rather than acreage enrollment provisions and 60 percent of the funds available for EQIP have historically been reserved for livestock operations.
Figure 3 applies the CBO score for each program change in the House farm bill to each state by estimating the state’s share of the increase or decrease in spending based on that state’s share of the historical obligations for the programs. For example, Illinois has historically received 1.38 percent of funds obligated for the Environmental Quality Incentives Program (EQIP) and 3.16 percent of the funds obligated for CSP. Thus, the Illinois share of the CBO score for CSP (-$398 million over 10 years) and for EQIP ($106 million over 10 years) is based on the state’s share of historic obligations, respectively. 
Figure 4 applies the same method to the CBO score for each program in the Senate farm bill. For example, the Illinois share of CSP obligations (3.16 percent) was used to estimate its share of the $1 billion reduction to CSP in the Senate bill ($31 million over 10 years).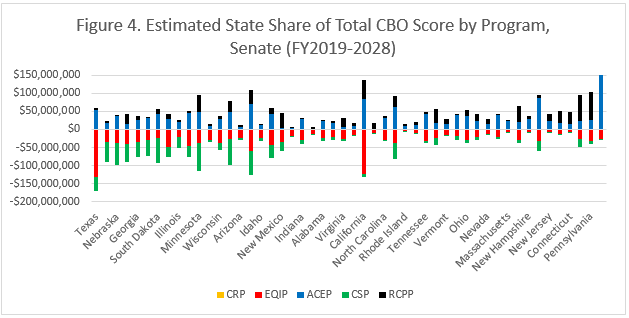
Figures 3 and 4 provide a comparison between the conservation titles of the House and Senate farm bills, respectively. Combined with Figure 2, these estimations of the potential changes to the distribution of funding among the states may raise concerns about harm to investments in working lands conservation to meet sustainable production and nutrient loss goals. Figure 5 illustrates a comparison between the State’s share of the acres planted to field crops and the State’s share of EQIP and CSP funding.
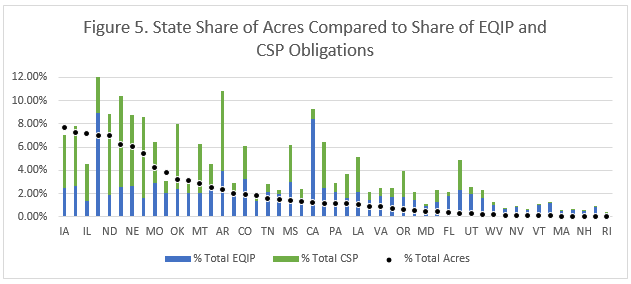 One takeaway from Figure 5 that may be relevant to the conference negotiations is that some of the states with large shares of total acres in field crop production are not receiving a share of total working lands funding commensurate with their acreage footprint. For example, Illinois represents 7.17 percent of the total acres planted to field crops nationally (average of 22.9 million acres from 2008 to 2017). It has historically received just over 3 percent of CSP funds but less than 2 percent of the total obligations for EQIP. Aside from whether the historic distribution of funds for these programs is appropriate—especially as measured against the share of acreage in production—Figure 5 would appear to raise concerns about eliminating CSP for large crop acreage states such as Illinois. Not only do those states stand to lose a significant amount of conservation investment, shifting to funds to EQIP might fail to offset the loss if future distributions follow historic patterns.
Additional issues changes may also exacerbate those impacts. For example, both the House and Senate bills contain provisions in EQIP that would make irrigation districts, irrigation associations, drainage districts, and acequias eligible for EQIP funding which may divert funds away from farmers and to these entities. The House bill also creates stewardship contracting authority in EQIP, presumably resembling some feature(s) of CSP that it eliminates. It is unknown how these changes might alter the impacts on funding at the state level. At the very least, these provisions are likely to shift significant funds to states with acres under irrigation. Doing so raises further questions about the historic distribution of program funds, as well as whether these shifts are appropriate. Conference negotiators will need to resolve such matters and the potential impacts on their states might prove an important consideration.
Finally, this analysis of funding and CBO scores also fails to take into account existing challenges for these programs such as backlogs and loss of funds due to rescission and sequestration. For example, the Congressional Research Service reported that in fiscal year 2017, CSP had a backlog of 4,260 applications that would have enrolled 4.4 million acres (Stubbs, 2018). CRS also reports that less than 30 percent of EQIP applications were in fiscal year 2017 with the cost of the backlog estimated at $1.7 billion (Stubbs, 2018). For EQIP, the expectations are that $115.5 million will be reduced through sequestration in FY2018 and that in FY2019, EQIP funding will be reduced by $252 million; $116 million for sequestration and $136 million rescinded.
This funding issue is a problem specific to EQIP as CBO data indicates a history of shortfalls from the amounts authorized by Congress. Figure 6 illustrates this issue by 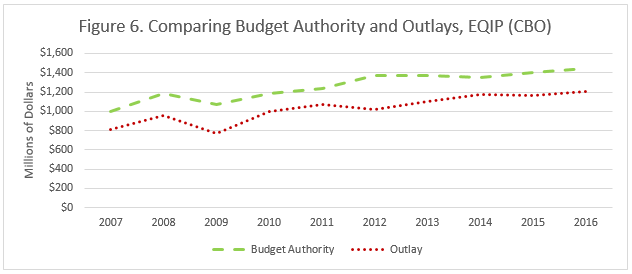 comparing the budget authority for EQIP each fiscal year (FY) to the actual outlays for that fiscal year (FY 2007 to 2016) as reported by CBO (CBO, USDA Mandatory Farm Programs). CBO data indicates that outlays for EQIP were a total of $2.3 billion less than budget authority provided by Congress in those years, which may represent a total loss of conservation dollars and might further complicate the proposal in the House to shift funds from CSP to EQIP. CBO reports that CSP outlays match budget authority in each fiscal year.
Finally, the potential impacts of reducing working lands conservation funding and, especially eliminating CSP, take on added significance given current economic realities for many farmers. After years of relatively strong prices, recent bumper crops have resulted in relatively lower prices, increasing stress on farm incomes and bottom lines (farmdoc daily, July 10, 2018; June 26, 2018; May 22, 2018). In recent months, prices for some crops have fallen significantly in the wake of escalating trade conflict through the imposition of tariffs on, and retaliation from, trading partners; soybeans and China have been notable components of this conflict (farmdoc daily, July 13, 2008; Farm Policy News, July 6, 2018). Figure 7 provides a measure of the impact on corn and soybean prices by calculating the daily futures settlement prices of the Chicago Mercantile Exchange as reported by Quandl.com (January 2, 2018 through July 13, 2018) as a percentage of the crop insurance projected prices used to establish the coverage for revenue insurance policies (farmdoc daily, March 1, 2018). The average price of the December corn contract in the month of February establishes the projected price for corn insurance ($3.96 per bushel), while the average price of the November soybean contract in the month of February sets the projected price for soybean insurance ($10.16 per bushel) (RMA Price Discovery). Each day’s settlement price for those contracts is compared to those projected prices to arrive at the percentages in Figure 7. 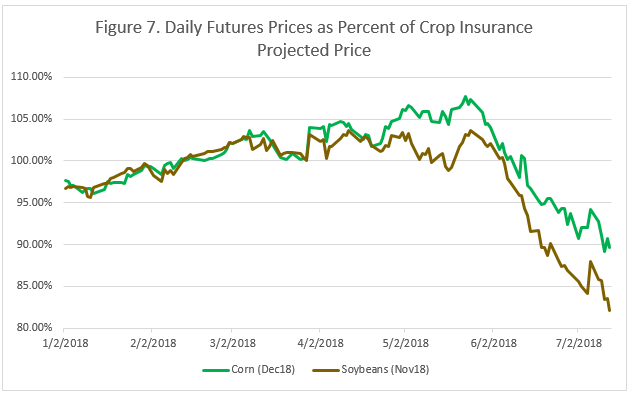
Because lower prices can reduce revenue and farm profits, they are important for farm management. Lower prices and profits are, in turn, important for natural resource conservation issues on productive farmland, such as reducing nutrient loss. Farmers under financial duress will find it exceedingly difficult to make costly investments in conservation practices to reduce nutrient loss. Cover crops offer a very relevant and clear example. Adopting the practice comes with significant cost to the farmer’s bottom line; a budget challenge magnified in times of financial stress from lower prices (farmdoc daily, June 28, 2018). The challenges would be magnified further if conference negotiators agree to eliminate CSP or significantly reduce funding for working lands conservation assistance, making for difficult issues for conference negotiators to resolve.
Concluding Thoughts
In summary, the states that receive the most in funding from conservation programs have the most to lose if those programs are eliminated or if funding is reduced. For conservation issues on productive farmland, like sustainable production and nutrient loss reduction, the impacts of cutting funds or eliminating CSP may be magnified in those states where the production is concentrated, such as those states with large acres planted to field crops. Current economic realities for field crops, especially corn and soybeans, raise further concerns. Combined, these realities support an argument that 2018 represents a particularly inopportune time to be scaling back on working lands conservation assistance to farmers. Unfortunately, both the House and Senate bills reduce working lands conservation but, of the two bills, the House goes much further. The House cuts funding more than the Senate and it eliminates CSP, thereby limiting the policy tools available to help farmers reduce nutrient loss, improve sustainability, and manage tough financial times. Such changes may also raise concerns for working lands conservation policy in terms of the weight and power of precedent. Once funding is cut, it can be difficult to restore; once a program is eliminated it will be difficult to resurrect those authorities or recreate the policies. Circumstances at the time of the changes add to the weight and power of any precedent. As such, eliminating CSP or cutting funding at this particularly inopportune time may have implications for working lands conservation policy that extend far beyond a shifting of dollars among states and farmers. Ultimately, these are matters to be considered by conferees as they seek to negotiate a final bill, as well as for supporters of the programs in the farm bill and for Senators and Representatives as they decide whether to vote for any final conference product.
References
Congressional Budget Office, “H.R. 2, Agriculture and Nutrition Act of 2018,” Cost Estimate (May 2, 2018), https://www.cbo.gov/publication/53819
Congressional Budget Office, “S.3042, Agriculture Improvement Act of 2018,” Cost Estimate (June 21, 2018), https://www.cbo.gov/publication/54092
Congressional Budget Office, “Details About Baseline Projects for Selected Programs, USDA Mandatory Farm Programs,” https://www.cbo.gov/about/products/baseline-projections-selected-programs#25
Coppess, J. 2018. “A Perspective on Agricultural Policy in the Age of Nutrient Loss,” Drake J. of Agric. L. (forthcoming).
Coppess, J. 2017. “A Return to the Crossroads: Farming, Nutrient Loss, and Conservation,” 39 U. Ark. Little Rock L. Rev. 351 (2017), https://lawrepository.ualr.edu/lawreview/vol39/iss3/1/
Coppess, J. 2016. “The Next Farm Bill May Present Opportunities for Hybrid Farm-Conservation Policies.” Choices. Quarter 4. Available online: http://www.choicesmagazine.org/choices-magazine/theme-articles/looking-ahead-to-the-next-farm-bill/the-next-farm-bill-may-present-opportunities-for-hybrid-farm-conservation-policies
Coppess, J. and B. Gramig . “Reviewing Directions in Conservation Policy: CSP and EQIP in the House Farm Bill.” farmdoc daily (8):104, Department of Agricultural and Consumer Economics, University of Illinois at Urbana-Champaign, June 7, 2018, https://farmdocdaily.illinois.edu/2018/06/reviewing-directions-in-conservation-policy-html.html
Coppess, J., G. Schnitkey, N. Paulson and C. Zulauf. “Reviewing the CBO Baseline for 2018 Farm Bill Debate.” farmdoc daily (8):65, Department of Agricultural and Consumer Economics, University of Illinois at Urbana-Champaign, April 12, 2018, https://farmdocdaily.illinois.edu/2018/04/reviewing-cbo-baseline-for-2018-farm-bill-debate.html
Good, K. “Looming U.S. – China Trade Battle: Soybean Trade Flows and Substitutes.” Farm Policy News: News Summary. Department of Agricultural and Consumer Economics, University of Illinois at Urbana-Champaign. July 6, 2018, https://farmpolicynews.illinois.edu/2018/07/looming-u-s-china-trade-battle-soybean-trade-flows-and-substitutes/
Schnitkey, G. “2018 Income Projections After Recent Price Declines.” farmdoc daily (8):126, Department of Agricultural and Consumer Economics, University of Illinois at Urbana-Champaign, July 10, 2018, https://farmdocdaily.illinois.edu/2018/07/2018-income-projections-after-recent-price-declines.html
Schnitkey, G. “What do $3.80 Corn and $10 Soybean Midpoints Mean for 2018 Crop Revenues?.” farmdoc daily (8):93, Department of Agricultural and Consumer Economics, University of Illinois at Urbana-Champaign, May 22, 2018, https://farmdocdaily.illinois.edu/2018/05/what-do-corn-and-soybean-midpoints-mean.html
Sherrick, B. and G. Schnitkey. “Crop Insurance Decisions for 2018.” farmdoc daily (8):36, Department of Agricultural and Consumer Economics, University of Illinois at Urbana-Champaign, March 1, 2018, https://farmdocdaily.illinois.edu/2018/03/crop-insurance-decisions-for-2018.html
Stubbs, M. “Agricultural Conservation: A Guide to Programs,” Congressional Research Service, CRS Report R40763 (April 17,2018), https://fas.org/sgp/crs/misc/R40763.pdf
Swanson, K., G. Schnitkey, J. Coppess and S. Armstrong. “Understanding Budget Implications of Cover Crops.” farmdoc daily (8):119, Department of Agricultural and Consumer Economics, University of Illinois at Urbana-Champaign, June 28, 2018, https://farmdocdaily.illinois.edu/2018/06/understanding-budget-implications-of-cover-crops.html
Swanson, K., G. Schnitkey, J. Coppess and N. Paulson. “Five-Year Income Projections for Grain Farms.” farmdoc daily (8):117, Department of Agricultural and Consumer Economics, University of Illinois at Urbana-Champaign, June 26, 2018, https://farmdocdaily.illinois.edu/2018/06/five-year-income-projections-for-grain-farms.html
Zulauf, C., J. Coppess, N. Paulson and G. Schnitkey. “U.S. Corn, Soybean, Wheat Exports and USSR Grain Embargo: Contemporary Implications.” farmdoc daily (8):129, Department of Agricultural and Consumer Economics, University of Illinois at Urbana-Champaign, July 13, 2018, https://farmdocdaily.illinois.edu/2018/07/us-corn-soybean-wheat-exports-and-ussr-grain-embargo-contemporary-implications.html